

ISIS Report 05/10/09
Dr. Mae-Wan Ho
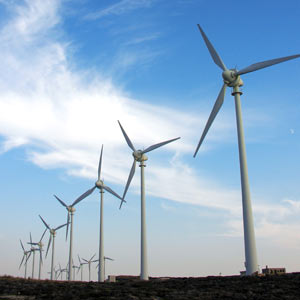
Wind power could electrify the world or provide its energy needs many times over, not necessarily with big turbines and wind farms
The enormous potential of wind power
Wind turbines on land could provide more than 40 times the world’s current electricity consumption or over five times its total energy needs. That’s the latest assessment using wind data from meteorological sources [1]. A network of 2.5-megawatt (MW) turbines on land restricted to non-forested, ice-free, nonurban areas operating at as little as 20 percent of their rated capacity would do the trick; allowing for the fact that the wind does not blow constantly. To put this into perspective, wind turbines installed in the US in 2004 and 2005 operate on average 36 percent of rated capacity.
For the United States, the central plain states could accommodate enough wind turbines to provide as much as16 times its total current demand for electricity.
Wind power is on a steep ascent. It accounted for 42 percent of all new electrical capacity added to the US in 2008; but it is still only a tiny fraction of the total capacity, 25.4 GW out of 1 075GW. The Global Wind Energy Council projected a 17-fold increase in wind-powered generation of electricity globally by 2030.
Simulating global wind fields based on state-of-the-art data Xi Lu and Michael McElroy at Harvard University, Cambridge Massachusetts in the United States and Juha Kiviluoma at the Technical Research Centre of Finland based their study on a simulation of global wind fields from version 5 of the Goddard Earth Observing System Data Assimilation System (GEOS-5 DAS) that includes global meteorological data from a wide variety of sources including surface and sounding measurements, measurements and observations from aircraft, balloons, ships, buoys, dropsondes (radio probe dropped by parachute) and satellites; the gamut of data that can provide the world with the best possible meteorological forecasts enhanced by application of these data in a retrospective analysis.
The land-based turbines are assumed to have a rated capacity of 2.5 MW with somewhat larger turbines, 3.6 MW, deployed offshore, to take account of the greater cost of
construction and the economic incentive to build larger turbines to capture the higher wind speeds available there.
In siting turbines on land, the study excluded densely populated regions and areas occupied by forests and environments distinguished by permanent snow and ice cover
(notably Greenland and Antarctica). Turbines located offshore were restricted to water depths less than 200 m and to distances within 92.6 km off shore.
Optimal spacing of the turbines in an individual wind farm involves a trade off between various costs: turbines, site development, laying power cables, routine operations and maintenance. Turbines must be spaced to minimize interference in airflow and requires a compromise between maximizing power generation per turbine and maximizing the number of turbines sited per unit area. For example, restricting overall power loss to < 20 percent requires a downstream spacing >7 rotor diameters, and a cross-wind spacing of > 4 diameters.
The power yield is assumed to be only a fraction (20 percent) of the maximum potential to account for the variability of the wind over the course of a year.
In this way, a world map of the annual wind power potential (W/m2) is obtained; and the country by country potential for both on land and off shore wind power also represented.
You may read the rest of this document here
http://www.i-sis.org.uk/windPowerElectricity.php
No comments:
Post a Comment